Beelove Bee Intelligence Maps
Satellite maps showing where bees can forage across Kenya — now, ahead, and long-term.
Season Ahead — October to December 2026
How this season's rainfall compares with the last 44 years, place by place. Built and tested on four decades of satellite rainfall records. Rain is the biggest driver of forage in Kenya's drylands, so a wetter season usually means a stronger bloom behind it.
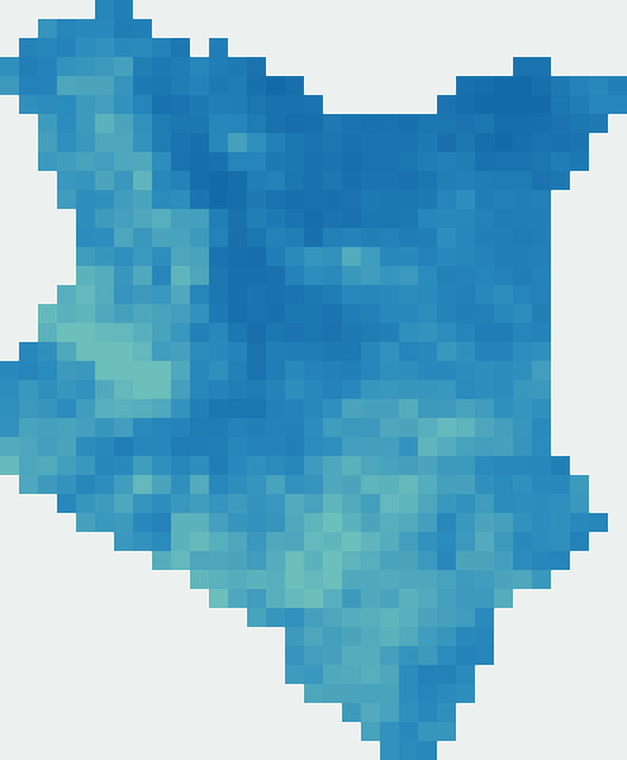
Chance of above-normal rainfall, October–December 2026. Tested against every year since 1982: this forecast beats a long-term average across 97% of Kenya. Read it alongside the Kenya Meteorological Department forecast.
Forage Timeline
Where bees can forage across Kenya, month by month — satellite-observed greenness for months already past, and a modelled outlook for the months ahead. Red diamonds on the interactive version mark the strongest flush each month.
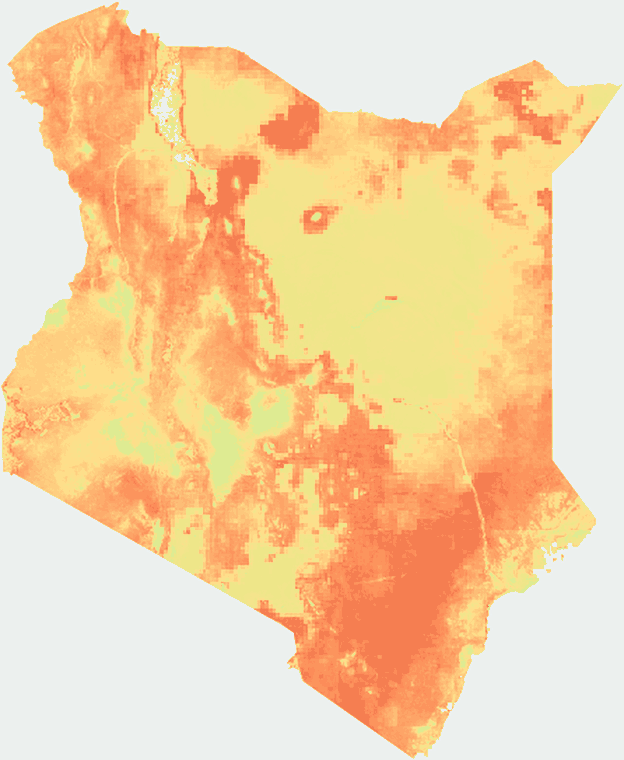
September 2026, modelled. The interactive version has a 15-month slider but is slow, and may not load when the satellite service is busy.
Beekeeping Suitability
Where bees thrive long-term across Kenya — from rainfall, temperature, elevation and vegetation, adjusted for urbanisation, farming, deforestation and light pollution. This is the map to check before deciding whether a place is worth putting hives in at all.
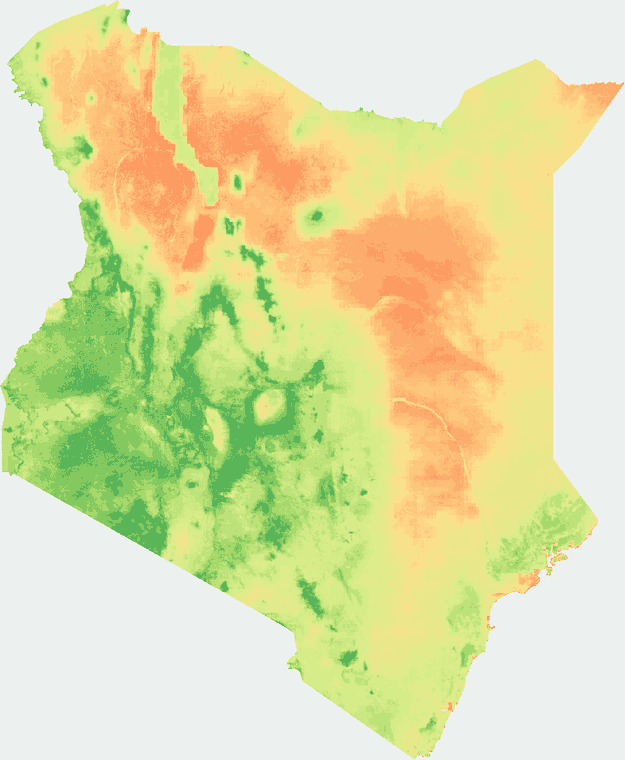
Long-term baseline. It changes slowly, so it does not need refreshing each season.
How to read these maps
Start with suitability
It answers one question: is this place worth keeping bees in at all? Long-run conditions, minus the things that spoil a site. Check it before you invest in hives.
Then the season ahead
Is the coming season better or worse than usual here? We can say this roughly six weeks before the rains break — not earlier. We tested it, and four months ahead there is no useful signal.
Your own calendar still rules
A wet season means different months in different places. On the coast the main bloom follows the long rains around April; in the south-east it follows the short rains. The Beelove app gives the month-by-month version for your county.
What we can and cannot claim: the rainfall forecast is tested against 44 years of records and we publish how well it scores. The step from rainfall to what a colony actually collects is not yet measured — that work is underway with farmers keeping records. Treat these maps as a guide alongside what you can see in your own field, never as a replacement for it.